Lifescope Project
An AI Software Searching for Solutions to Healthcare Problems
Published
- 4 min read
Some History
In March 2017, my friend Juan Fernández invited me to join him in developing a software project he had been working on as a side initiative. It was a Python script that used spaCy to analyze messages from a Twitter stream.
The idea was to leverage the Natural Language Processing (NLP) capabilities of spaCy to identify English messages proposing solutions to healthcare problems. The script would tag both the problem and its proposed solution while discarding irrelevant messages.
Additionally, the script analyzed the authors of the messages, automatically tagging them (e.g., doctor, news source, patient).
Juan had a working prototype on his computer but wanted to share it with the world. I suggested turning it into an online web application accessible to everyone and making it open source. Today, the first version of our software is available online at https://www.lifescope-project.com.
Architecture
From Local Script to the Cloud
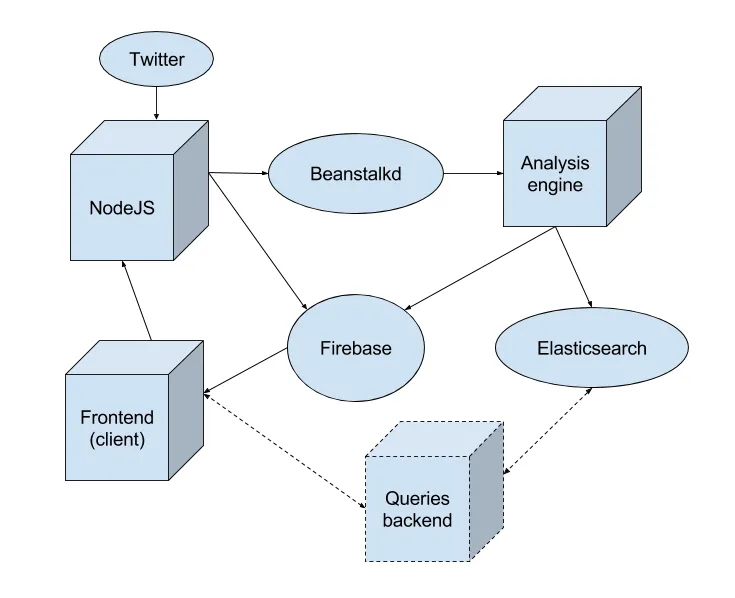
After experimenting with Flask, I decided it was best to separate the analyzer from the Twitter stream and backend services. We aimed for a system that scales and is easily maintainable. This led to the following microservices-based architecture:
- A Node.js service, which sends messages from the Twitter stream to a beanstalkd job queue.
- The Python analysis engine, which processes jobs from beanstalkd and stores the results in Firebase and Elasticsearch.
- Firebase DB, which serves the analyzed messages in real time to the frontend.
- A ReactJS + Redux-based frontend, which showcases the project with an introduction, a link to the project’s blog, and a real-time timeline of analyzed messages.

Features
This architecture allows us to display analysis results in real time, while also saving them permanently in Elasticsearch to facilitate integration with an upcoming statistics module. Firebase handles the WebSocket connections, so our services only need to respond to on-demand requests, simplifying scalability. To optimize performance, we clean the Firebase database every three hours, ensuring it loads quickly. The free Firebase plan with 2GB of storage is sufficient for our current needs.
The analysis engine is now decoupled from the source, processing jobs from beanstalkd in a generic JSON format. This flexibility will enable us to extend streaming services to include sources beyond Twitter, such as specialized news feeds.
The Node.js service also provides an endpoint where the frontend can post new messages, allowing visitors to test the analysis engine and view the results instantly on the timeline.
Deployment
Everything is dockerized, making the installation and deployment of the entire system seamless. This approach allows us to easily migrate our services if demand grows. Currently, we’ve deployed it to a VPS, which operates 24/7, building an intriguing database for analysis using Big Data tools.
And Why Did You…
-
Use React and Redux for such a simple frontend?
Side projects give me the opportunity to experiment with technologies I’m not yet an expert in. Initially, I started writing the frontend with Angular, but since I already had other active projects using Angular, I decided to rewrite it in React and Redux. I enjoy using side projects to explore new tools and frameworks that I don’t frequently use in my day job. While React alone might have sufficed, Redux adds scalability if the frontend evolves into something more complex (which seems likely). -
Use a VPS instead of deploying to AWS?
A VPS is very affordable and perfectly meets our needs for this initial phase. Moreover, we’re comfortable maintaining a couple of Linux machines ourselves.
Further Steps
The next step is to leverage the information stored in Elasticsearch. We plan to build a new backend service (likely Clojure-based) that will deliver Big Data analysis results to the frontend. D3.js will undoubtedly be a valuable tool for visualizing this data on the frontend.
Back to the top ↑
